HVAC Lifecycle Cost Analysis (LCCA) Software
Compare HVAC options on discounted lifecycle cost — first cost, energy, maintenance, refrigerant and replacement — with energy derived from the equipment selection, breakeven stated as a year, and the ranking tested across energy-price assumptions.
Watch with transcript →0:49 · captions · narrated demo
Software Modules
Lifecycle Cost Analysis Screens
Screens from the running system — click a module to preview

Lifecycle Energy & Cost
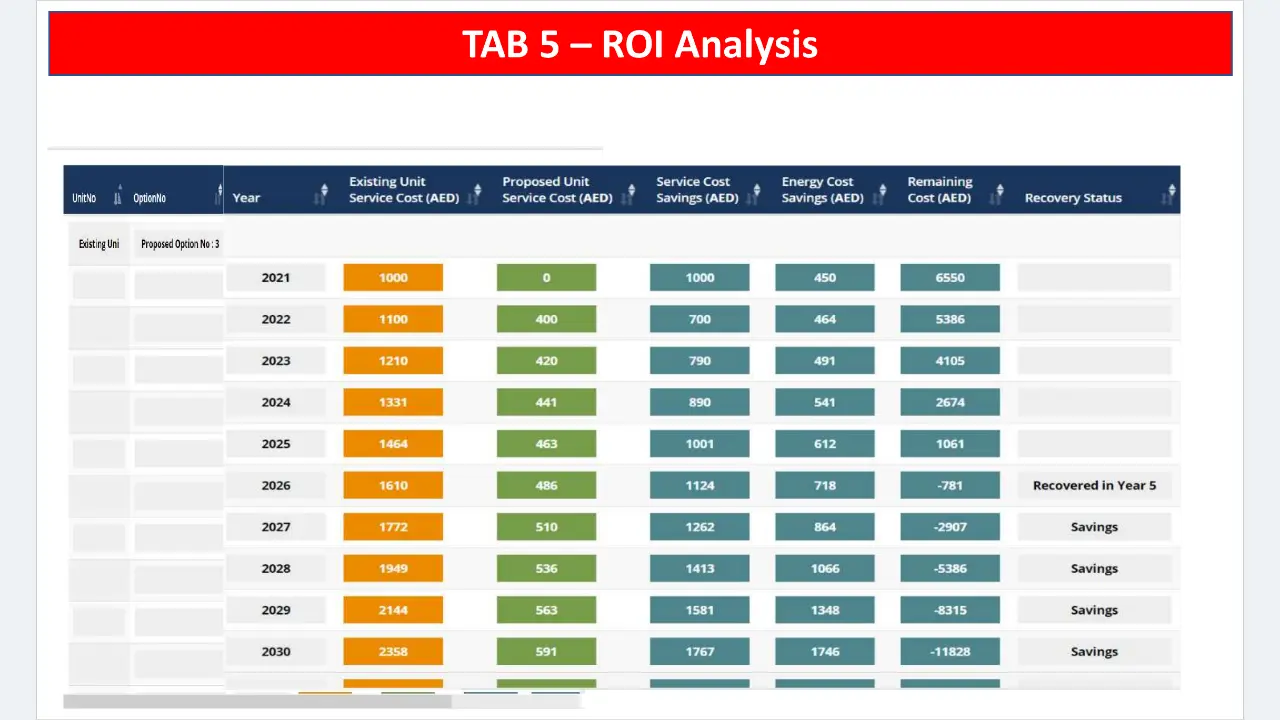
Compare the existing unit against each proposed option year by year, with escalation and age-related derating priced across the horizon.
HVAC lifecycle cost analysis that survives a hostile review
MileSoft Lifecycle Cost Analysis compares HVAC equipment options on discounted total cost of ownership over a 10 to 15 year horizon, the period commercial tenders increasingly ask for. It carries five cost categories — first cost, energy, maintenance, refrigerant and replacement — and discounts them following ISO 15686-5 and NIST Handbook 135, rather than multiplying annual energy by the number of years.
The energy term is derived from the equipment selection that specified each option — chiller part-load rating, air handler fan power, energy recovery net gain — instead of being typed in. When a selection changes, the analysis changes with it, so a lifecycle comparison cannot quietly drift away from the engineering it is supposed to describe.
A guided nine-step wizard handles single-unit, multi-unit and new-construction comparisons: cost details per option, a year-by-year energy model with escalation and derating, return on investment and the breakeven year on discounted savings, an electrical-infrastructure step that sizes transformers, and a carbon account. Results are reported as a stability range across discount and escalation assumptions, so a client can see whether a recommendation depends on an energy-price forecast.
HVAC lifecycle cost analysis
What a lifecycle cost analysis is, and what most HVAC tenders receive instead
Annual energy multiplied by fifteen years is not a lifecycle cost.
Commercial HVAC tenders routinely ask for a 10 to 15 year lifecycle cost analysis. What usually arrives is annual energy consumption multiplied by the horizon, perhaps with a maintenance allowance. A lifecycle cost instead carries five categories — first cost, energy, maintenance, refrigerant and replacement — discounts them, and states what it does not know. Only first cost is a number; the rest are assumptions, and an analysis that hides that is less useful than one that shows it.
LCC = first cost + Σ over years (energy + maintenance + refrigerant + replacement) ÷ (1 + discount rate)^year
The discounted-cash-flow convention codified in ISO 15686-5 for constructed assets and NIST Handbook 135 for energy projects. An analysis that omits replacement cost or compares undiscounted cash flows is not a looser version of the method; it is outside it.
Energy is not a constant either. It is annual consumption rising with equipment derating, times a unit price rising with escalation, over the operating profile the selection established: energy(year) = consumption × (1 + derating)^year × price × (1 + escalation)^year.
Derived energy
Where the energy number comes from decides whether the analysis survives review
A reviewer's first question is always the same.
Annual consumption for each option is produced by the equipment selection that specified it — the chiller module's part-load rating, the air handler's fan power, the energy recovery device's net annual gain — rather than typed into the lifecycle model separately.
Where selection and lifecycle model are separate files, a late change to a coil or a chiller updates one and not the other, and the divergence is invisible in the submitted document. Where they share a source, a change propagates or the analysis refuses to run.
It also changes what a challenge means. A reviewer disputing the energy figure is now disputing the equipment selection — a technical argument with certified performance data behind it — instead of a spreadsheet cell with no provenance. That is the difference between a lifecycle comparison that is read as advocacy and one that is read as a consequence.
NPV and breakeven
Breakeven as a year, measured on discounted savings
"Year six" is a date a facilities manager can set against a lease. "Three-year payback" is an abstraction.
NPV = − extra capital + Σ (annual saving ÷ (1 + discount rate)^year)
The breakeven year is the first year in which discounted savings to date have recovered the extra capital. Defined on discounted rather than nominal savings it is the conservative figure — and the gap between the two grows with the discount rate, exactly when it matters most.
Worked example: fifteen years, discounted at 8%
A baseline costs 4,200,000 and uses 620,000 kWh a year; the proposed option costs 5,400,000 and uses 486,000 kWh. Energy is 9.50 per kWh escalating at 5%, derating 1% a year for both; maintenance is 95,000 against 118,000. First-year energy cost is 6,246,555 against 4,896,320, so the net operating saving is 1,327,235. Discounted at 8% that is 1,228,921 — already more than the 1,200,000 premium. Breakeven is year 1, with fourteen years of advantage after it.
Sensitivity
When the ranking depends on an assumption, the analysis should say so
Discount rate and energy escalation are the two inputs a conclusion is most sensitive to, and neither is knowable.
Instead of one point estimate, the tool reports the range over which the ranking between options stays stable — in practice, the comparison run at 4% and at 7% annual energy escalation.
Make the options closer: a premium of 3,400,000 for a 60,000 kWh annual saving. At 5% escalation, discounted savings over 15 years are about 5.55 million; at 4%, about 5.16 million; at 7%, about 6.42 million. The ranking holds across the range, so the recommendation is a recommendation. Had the premium been 6,000,000, net present value would be negative at 4% and positive at 7%.
An analysis whose ranking flips between 4% and 7% escalation has not identified the better option. It has identified an assumption — and telling the client their decision depends on their own view of energy prices is more useful than either number alone.
Infrastructure and refrigerant
The two costs a purely operational comparison never shows
A transformer rating step, and a refrigerant whose supply is contracting.
kVA = connected load ÷ power factor · transformer kVA = kVA ÷ utilisation
A baseline presenting 385 kW at a power factor of 0.88 and 0.80 utilisation needs 546.9 kVA — a 630 kVA transformer. A proposed option at 352 kW needs 500.0 kVA — it fits a 500 kVA unit. A 33 kW reduction, about 8.6%, has crossed a rating boundary, and the capital avoided can exceed the equipment premium outright. Energy savings accrue smoothly; a transformer either is or is not required.
Refrigerant is the other. Regulation (EU) 2024/573, in force from 11 March 2024, tightens the phase-down of hydrofluorocarbons. For a 15-year analysis that turns refrigerant from a commissioning charge into a rising cost trajectory: as quota tightens, topping up a machine on a phasing-down refrigerant costs more, and by the end of the horizon availability itself is a question. A model carrying refrigerant as a fixed annual figure understates the cost of the option that depends on it most. The carbon account carries direct and indirect emissions across the horizon for the same reason.
Why spreadsheet LCCA fails
Five failure modes of spreadsheet lifecycle analysis
Each one tilts a comparison without anyone intending it to.
Energy times horizon
Annual consumption multiplied by years, with no discounting, no escalation and no derating as equipment ages.
Energy entered by hand
Consumption is retyped from a selection into a separate spreadsheet, so a later change to the selection silently invalidates the analysis. The most consequential failure, and the least visible.
Categories omitted
Replacement and refrigerant are left out because they are uncertain, biasing the comparison toward whichever option they would have penalised.
Point estimate presented as certainty
One discount rate and one escalation assumption produce one answer, with no indication of how narrowly it holds.
Baseline chosen to flatter
The comparison baseline is set at minimum compliance rather than at the option the client would otherwise buy.
Evaluating LCCA software
Eight questions to put to any lifecycle cost analysis software
Each is answerable by demonstration — including by us.
| # | Dimension | Ask the vendor to demonstrate |
|---|---|---|
| D1 | Derived energy | Change an equipment selection. Does the lifecycle analysis update, or keep its old figure? |
| D2 | Five categories | Are first cost, energy, maintenance, refrigerant and replacement carried separately? |
| D3 | Discounting | Are future cash flows discounted, with the discount rate an explicit input? |
| D4 | Escalation and derating | Does annual energy cost carry both price escalation and equipment performance derating? |
| D5 | Sensitivity range | Is the stability boundary of the ranking reported, or only a point estimate? |
| D6 | Discounted breakeven | Is breakeven defined on discounted savings, or on nominal ones? |
| D7 | Electrical infrastructure | Is connected load translated into transformer sizing, with its discrete cost step? |
| D8 | Refrigerant trajectory | Is refrigerant a rising cost across the horizon, or a fixed annual figure? |
D1 separates an integrated tool from a spreadsheet with a better interface. Change the chiller and watch whether the lifecycle model notices.
On evidence: no adoption, time-saving or accuracy figure is published for this module. MileSoft publishes an engineer-hour model — about four hours for a manual 20-year, five-category analysis against twenty minutes in the tool, at eight analyses a month, roughly 352 hours a year. The saving that model does not count is the larger one: analyses never produced because four hours could not be found, and tenders answered on first cost as a result. The HVAC case study covers a programme in which this was one of four modules; its results are not claimed here.
Standards referenced: ISO 15686-5, NIST Handbook 135, Regulation (EU) 2024/573, ANSI/ASHRAE/IES 90.1, ISO 16358-1, ANSI/AHRI 550/590, AHRI 340/360. Part-load efficiency inputs can be explored with the IPLV and NPLV calculator; derivations are in the lifecycle cost analysis method paper.
Features
Key Features
Built-in capabilities that set our software apart
Five cost categories
first cost, energy, maintenance, refrigerant and replacement, discounted per ISO 15686-5 and NIST Handbook 135
Derived energy
consumption comes from the chiller, air handler or energy recovery selection, not a typed figure
Escalation and derating
energy cost rises with price escalation and with equipment performance derating
NPV and breakeven year
breakeven measured on discounted savings and stated as a year
Sensitivity range
the ranking tested across discount and escalation assumptions, such as 4% and 7%
Electrical infrastructure
connected load translated into transformer sizing and its discrete cost step
Carbon account
direct and indirect emissions across the horizon
Benefits
Key Benefits
What your team gains from adopting our platform
Testimonials
What Our Clients Say
Trusted by industry leaders across manufacturing, HVAC, and logistics.
"MileSoft's product excellence and implementation are top-tier, consistently exceeding expectations. We value their dedication to solving challenges and delivering long-term solutions. After-sales support is exceptionally reliable."
FAQ
HVAC Lifecycle Cost Analysis (LCCA) Software — FAQs
Answers to the most common questions about this product. Need more? Book a demo or reach out via Contact.
Why is first cost not enough?
How does this differ from an Excel model?
Which cost categories are included?
Does it produce NPV and payback?
What if energy prices move?
Explore More
Related Products
Complementary tools teams often pair with this solution
Related Reading
Go deeper
Explore the long-form story behind this product.
Five Cost Categories and a Discount Rate: Making HVAC Lifecycle Comparisons Defensible
Architecture, Computational Methods, and Field Evidence from MileSoft Lifecycle Cost Analysis
Read the paperRead the full HVAC Lifecycle Cost Analysis (LCCA) Software deep-dive
Read articleSee how MileSoft delivers in HVAC
Read case studySee your savings in under a minute
Estimate the time and cost this tool could give back — free, instant, no sign-up.
Put a real tender comparison through the eight questions
Bring two options from a live bid. We will run them over your horizon, show the breakeven year and the escalation range where the ranking holds, and flag any transformer step.